
Returns are not a single problem. They are four or five different problems wearing the same costume, and every one of them has a different fix. A return caused by a sizing guess is not the same as a return caused by a cracked item, and treating them the same is why most "reduce returns" efforts stall. This playbook sorts returns into their real drivers, gives you the fix for each, and shows you how to read your own returns data so you spend effort on the SKUs that are actually bleeding.
Key Takeaways
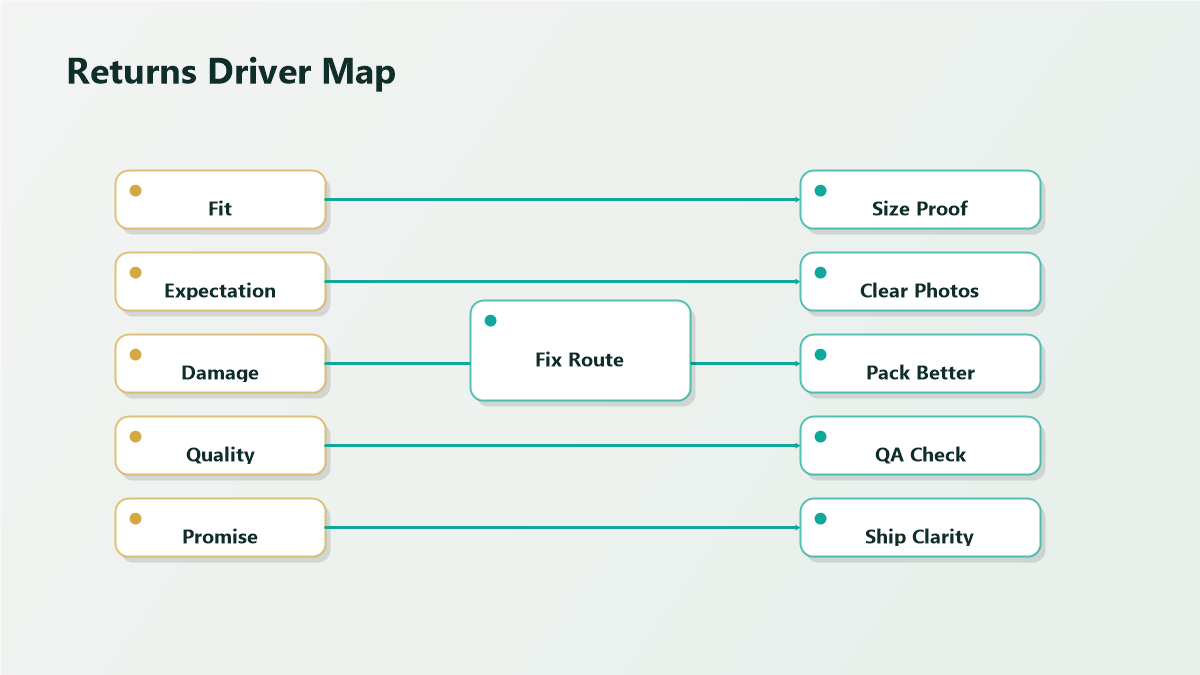
- Returns cluster into a handful of drivers: sizing and fit, wrong expectations, transit damage, and genuine defects. Each has a distinct fix.
- The fastest wins come from listing and content corrections, because they cost nothing to ship and prevent the return before it happens.
- Packaging and quality control fixes address the returns content cannot prevent: the item that arrives broken or fails early.
- Returns data tells you which driver dominates each SKU. Read it before you change anything, or you will fix the wrong thing.
- Target the worst offenders. A small set of SKUs usually generates a disproportionate share of returns and refunds.
Start by Naming the Driver
Before any fix, sort the return into one of four buckets. Most marketplaces give you a buyer-stated return reason, and while buyers do not always pick the precise reason, the pattern across dozens of returns is reliable.
A fifth bucket, "no longer needed" or "bought by mistake," is buyer-side and largely outside your control. Track it, but do not chase it.
Fixes by Driver
Sizing and fit
This is a content problem disguised as a product problem. Buyers return because the item did not match the size they pictured.
Wrong expectations
The fix is honesty in the imagery and copy. Over-promising the photo is the single most common cause of "not as described."
Transit damage
Content cannot fix a box that arrives crushed. Packaging and fulfillment can.
Defects and performance
This is the only bucket that points back at the product itself, and the most expensive to ignore because it also drives negative reviews.
Read the Data Before You Act
Pull your returns report for a trailing period and do three things.
- Rank SKUs by return rate and by total refund dollars. These are different lists. A low-rate, high-volume SKU can cost more than a high-rate niche item. Fix where the money is.
- Within the worst offenders, break returns down by stated reason. This tells you which driver dominates that SKU and therefore which fix to deploy.
- Watch the trend, not just the level. A return rate climbing over recent weeks signals a new cause: a packaging change, a supplier batch, a listing edit, or a new competing offer that reset buyer expectations.
A return rate in isolation means little; the same number is a crisis for a high-margin electronics SKU and a non-issue for a low-cost consumable. Benchmark each SKU against its own history and its category norm.
A Worked Routine
Mini-Scenario: The Return Rate That Was a Photo Problem
A homeware brand saw one SKU's return rate run well above its catalog average. The instinct was a quality problem, and a supplier audit was nearly commissioned. The returns breakdown told a different story: the dominant reason was "color not as described." The main image had been shot under warm studio lighting that made a cool gray product look beige. Buyers ordered beige and received gray. The fix cost nothing but a reshoot under neutral light and a corrected swatch callout. The return rate fell back toward the catalog average within a few weeks, and no supplier was ever at fault.
FAQ
What return rate is considered normal for ecommerce?
It varies enormously by category. Apparel and footwear run far higher than consumables or tools. Benchmark each SKU against its own history and its category rather than a single universal target.
Should I make returns harder to reduce my return rate?
No. Friction-heavy returns suppress the metric while damaging reviews, repeat purchase, and marketplace standing. The durable path is preventing the return, not blocking it.
Which fix gives the fastest payback?
Listing and content fixes, because they prevent the return before anything ships and cost nothing to deploy. Start there, then move to packaging and quality control for the damage and defect drivers content cannot touch.
How do I know if returns come from damage or a real defect?
Read the verbatim comments. "Arrived broken" with intact packaging points to transit handling; "stopped working after two days" points to a defect. Tracking by batch helps separate a one-off from a manufacturing pattern.
Do returns hurt more than the refund itself?
Usually yes. Beyond the refund, returns carry return shipping, processing and disposal costs, lost inventory value, and the review and ranking damage a frustrated buyer can cause. That is why prevention pays better than acceptance.
Bring Your Return Rate Down on Purpose
Returns reward a methodical operator: name the driver, deploy the matching fix, and let the data confirm it worked. If you want the worst offenders in your catalog audited and the content, packaging, and QC fixes mapped for you, Qubeq can run the returns analysis and turn it into a prioritized action plan.